
Who this is for
COOs, Ops leaders and team managers who need measurable improvements in cost-to-serve and delivery performance without a heavy transformation program.
1) Quick wins: the top 10 levers
- Intake triage: clarify SLAs & ownership; kill "misc" queues.
- Batching & WIP limits: smaller lots, fewer items in progress.
- Standard work: turn tribal knowledge into one-page SOPs.
- Template replies/tasks: macros for the top 20% of requests.
- Defect logging: visible rework reasons; fix the top 3.
- Handover rules: RACI + checklist before passing work.
- Calendar blocking: focus blocks for deep-work windows.
- Skills matrix: cross-train to remove single-threaded owners.
- Demand shaping: tighten eligibility / form fields / guardrails.
- Obvious automation: 3–5 no-code jobs (alerts, status, sync).
2) The 30/60/90-day plan
- 0–30 days: baseline KPIs, map the flow, implement intake triage, launch SOPs v1.
- 31–60 days: WIP limits, defect logging, automation pilots, skills matrix.
- 61–90 days: scale what works, renegotiate SLAs, publish the dashboard to execs.
3) KPI model
Keep it lightweight and comparable week over week:
- On-time delivery (OTD) = % tasks/orders delivered on or before the promise date.
- Cycle time = average start→finish per type (exclude waiting for customer).
- SLA attainment by queue/type.
- First-time-right / defect rate = % items without rework.
- Backlog health = items over SLA + aging distribution.
- Cost-to-serve = FTE hours × loaded rate per item / order.
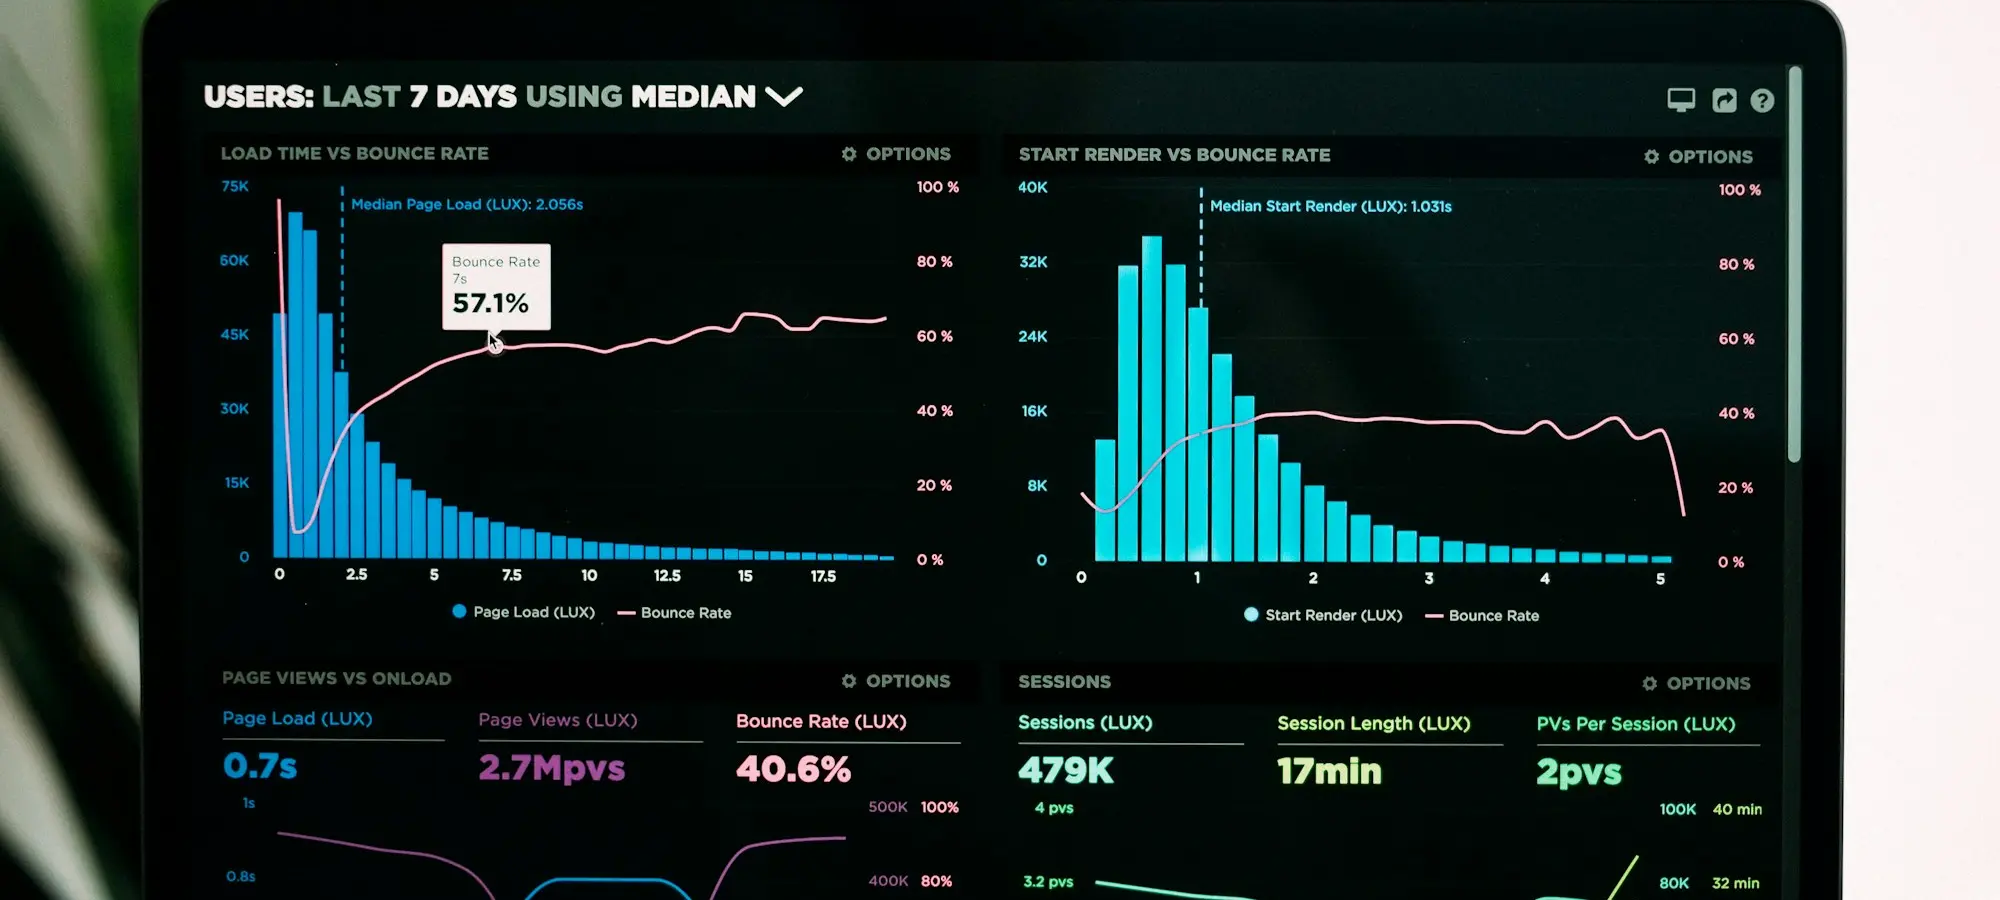
4) Dashboard layout (one-pager)
- Top bar: OTD, cycle time, defect rate, cost-to-serve (vs. target).
- Trends: 8-week sparklines for each KPI.
- Bottlenecks: queues with the worst SLA & aging.
- Wins this week: 3 bullets (automation saved X hours; defect Y removed).
- Risks / help needed: escalations, cross-team dependencies.
Download: KPI dashboard (Google Sheets)
5) Instrumentation
- Start with an operational export (CSV/Sheet) daily; automate later.
- Create a data dictionary (how we timestamp, what counts as done).
- Tag defect causes in the ticketing tool; keep the taxonomy under 12 items.
- Use unique IDs for items to avoid double counting across systems.
6) Review cadence
- Weekly, 30 min: KPI review, wins, top 3 blockers, next experiments.
- Monthly, 60 min: trends vs. targets, SLA resets, resourcing decisions.
- Quarterly: re-baseline cost-to-serve; publish the 3 biggest improvements.
7) Common risks
- Too many KPIs → pick six that move the business.
- Counting "busy work" → measure outcomes, not activity.
- Data hygiene ignored → implement a weekly data check.
- One-off wins → keep an experiments backlog with owners.
Templates
One-page KPI dashboard · SOP template · Defect log (Sheets) · 30/60/90 plan · Ops experiments backlog
Want us to stand up your dashboard and quick-wins board in two weeks?
Book a 30-min ops review